Clicking the Speech Mapping
icon ![]() on the center of the screen.
on the center of the screen.
From the Tools menu.
Navigating to the Speech Mapping screen.

Speech Mapping is a feature of Inspire to be used for verification of good speech audibility and comfort in the fitting. Speech Mapping can be accessed in three places in the software:
Clicking the Speech Mapping
icon ![]() on the center of the screen.
on the center of the screen.
From the Tools menu.
Navigating to the Speech Mapping screen.
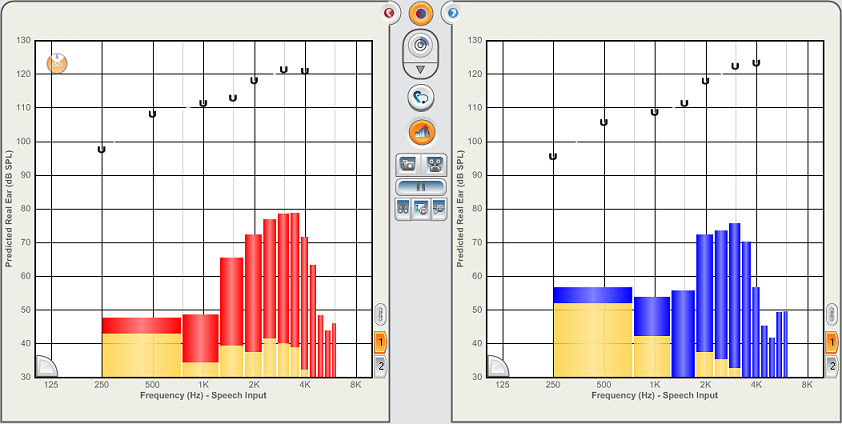
Once Speech Mapping is activated or the user is on the Speech Mapping
screen, the frequency response graph changes to display the real-time
information of the hearing aids via bars, cylinders, or lines for a speech
input. To pause the real-time feed, click the Pause
button ![]() located in the grouping
of Speech Mapping buttons between the graphs. Once the recording is paused,
this icon will change to a Play
button
located in the grouping
of Speech Mapping buttons between the graphs. Once the recording is paused,
this icon will change to a Play
button ![]() . To resume recording,
click the Play
button.
. To resume recording,
click the Play
button.
Speech Mapping provides three display options: Input, Output and Input + Gain. Both the Input and Output displays will use solid, red and blue colored bars or lines for the active measurement, for the right and left ears respectively. When the Input + Gain option is displayed, two different colors may be displayed: the input will be represented by the yellow bars or lines and any additional gain will be represented by the dark colored (blue/red) bars or lines.

Speech Mapping can be activated simultaneously with any of the following features of Inspire: QuickFit, Fine Tuning, Band, Channel, Compression, Max Output, Volume Control/Gain, Feature Validation, Memories and Expert Assistant. Speech Mapping measurements can be obtained in any of the acoustic memories. Memories can be selected while the curve is active by selecting the appropriate memory tab.
On the dedicated Speech Mapping screen or via the Speech Mapping buttons between the graphs, there are many different captures, display and view options.
|
Click to obtain a single line capture of the hearing aid’s live response. |
|
Click to obtain a capture region of the hearing aid’s live response averaged for up to 10 seconds. |
|
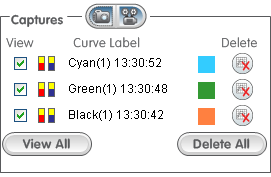
Click to display a dialog to show/hide, change the color, change the name, and/or delete the captures. |
|
On the Speech Mapping screen, this information is embedded into the bottom control panel. |
|
Click to display a dialog to manage the graph display. The options are: Audiometric Thresholds, Soft Target/Response, Moderate Target/Response, Loud Target/Response, or Max Output. |
|
On the Speech Mapping screen, this information is embedded into the bottom control panel. |
|
Click to display a dialog to manage the view of the real-time feed and resulting captures. Two different options are controlled here:
|
|
On the Speech Mapping screen, this information is embedded into the bottom control panel. |
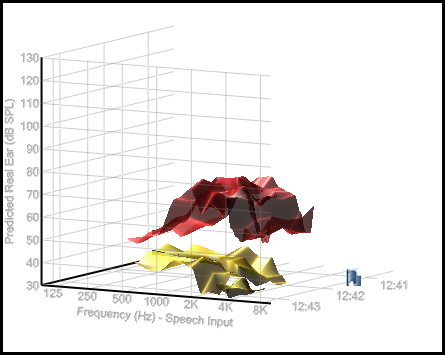
Live 3D Speech Mapping includes a contoured shape of the dynamic changes
in speech over time. Inspire allows you to view the curves in 3D and continue
to make a real-time recording  .
As changes are made to the hearing instrument, flags will be placed at
the point of change. Once the recording is paused, it can be reviewed
by moving the cursor to the point of change via the recording bar
 ![]() . The graph also allows the ability
to rotate the entire frequency response. By clicking on the frequency
response curve, dragging and dropping it will allow you to rotate the
view upward, downward and side-to-side.
. The graph also allows the ability
to rotate the entire frequency response. By clicking on the frequency
response curve, dragging and dropping it will allow you to rotate the
view upward, downward and side-to-side.
There are 2 additional buttons and the Input Monitor on the Speech Mapping screen. These provide more information and additional functionality for Speech Mapping.
|
Click to begin Integrated Speech Mapping. |
|
Click to obtain help information for using the Input Monitor and Integrated Speech Mapping. |
|
This gauge shows the average input at the hearing aid microphone. It can be used to calibrate sound files from the media player or to analyze the input level of a sound for troubleshooting or counseling. |
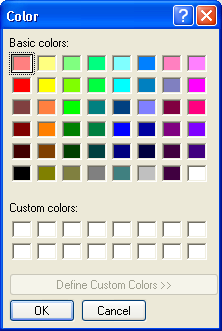
Inspire also offers the ability to customize the color of the Speech Mapping curves as they are displayed. Once a curve is recorded and displayed, the color of the curve can be changed. By clicking on the square to the right of the text box in the captures area of the control panel or the captures dialog, a color palette of 64 available colors will be displayed. Select one of the available colors and the color of the box and curve will be updated with the new color choice.

